4.1.4. Results
Figure 4 illustrates how the transport sector is represented in the model, using key elements like fleet composition, freight and passengers demands and energy consumptions.
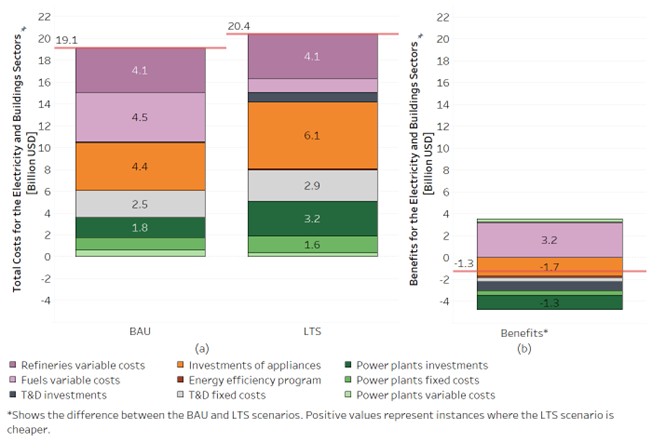
Figure 4: Preliminary results for the Electricity and Buildings sector: (a) costs of the BAU and LTS scenarios, and (b) benefits of implementing the LTS -cost difference between the BAU and LTS scenarios-.